SIR Epidemic
bio · 36 views
bio
What It Is
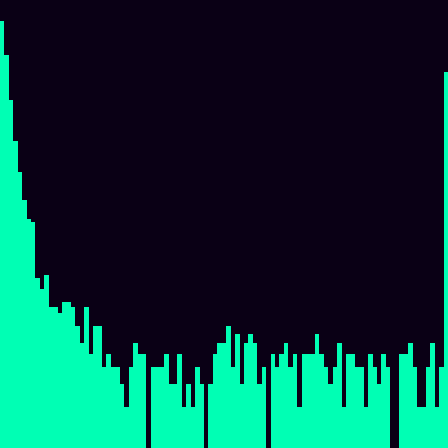
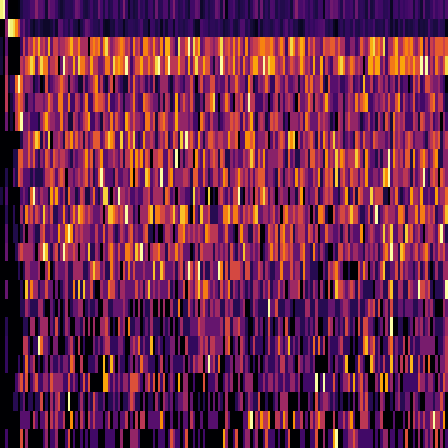
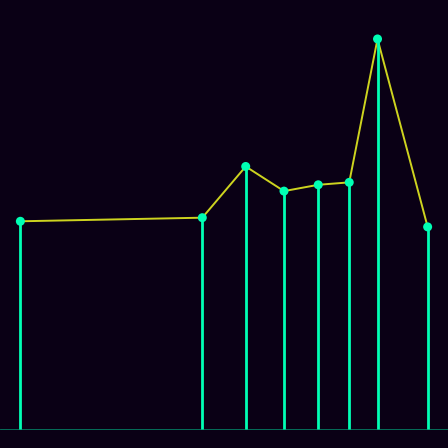
Stochastic SIR model --- infection waves with exponential rise, peak overshoot, and power-law decay
Interpretation
Standard analysis sees: heavy-tailed; smooth / autocorrelated; long-range memory (persistent); volatility-clustering (bursty); nonstationary / drifting. The atlas finds no named structure, but the source is distinctively extreme on Isochronicity:amplitude_exploration (+2.2z) — beyond what the standard bank predicts for it.
What standard analysis sees
tail heaviness0.89
asymmetry0.85
occupancy0.42
short-range corr0.87
long-range memory0.93
spectral colour0.20
periodicity0.73
complexity0.58
time-irreversibility0.78
volatility clustering0.90
multifractality0.43
dimensionality0.25
nonstationarity0.99
What the atlas adds
Atlas-extreme metrics the standard bank can’t predict for this source
Isochronicity:amplitude_exploration | +2.2z | bank-miss 1.5σ |
Composition
dtypefloat64
range[0, 8.244]
unique values628 / 16384
mean ± std0.417 ± 1.42
Render Gallery
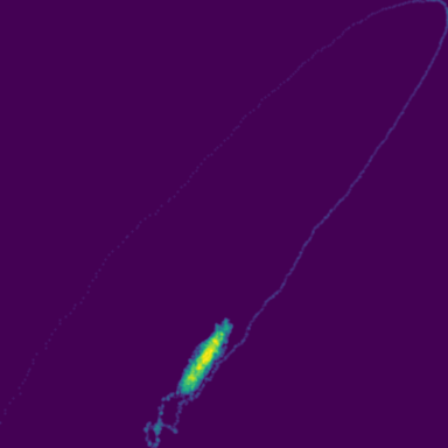
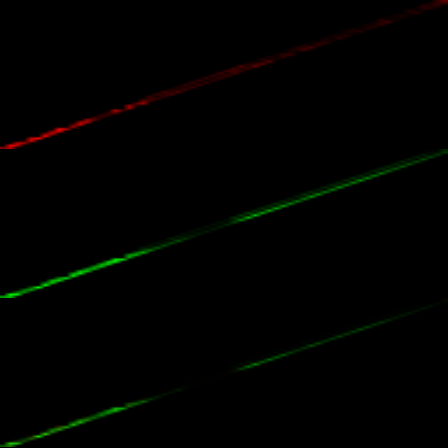
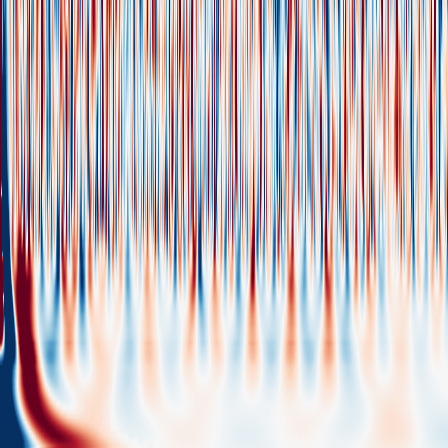
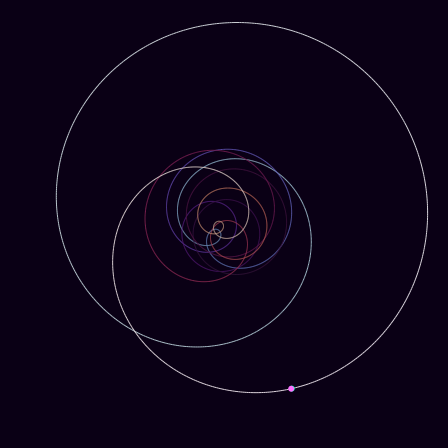
Native > phase_plotraw
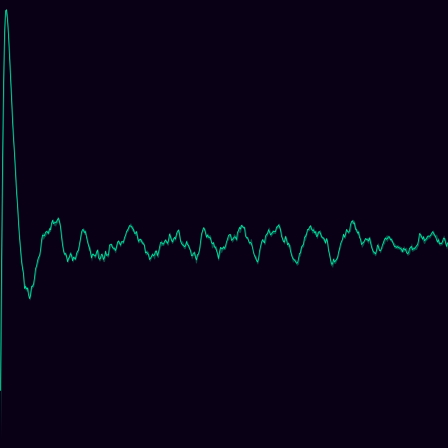
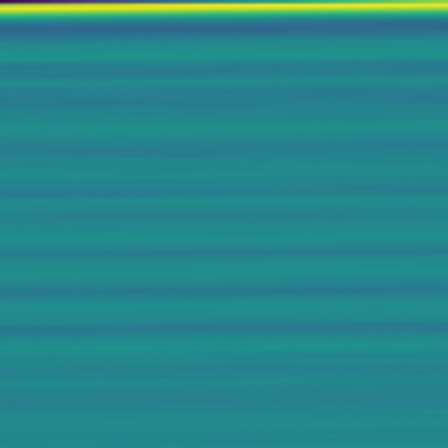
Native > timeseriesraw
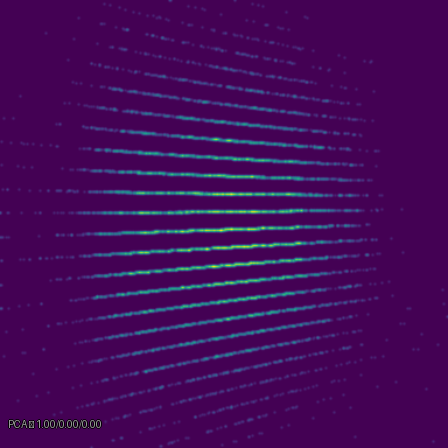
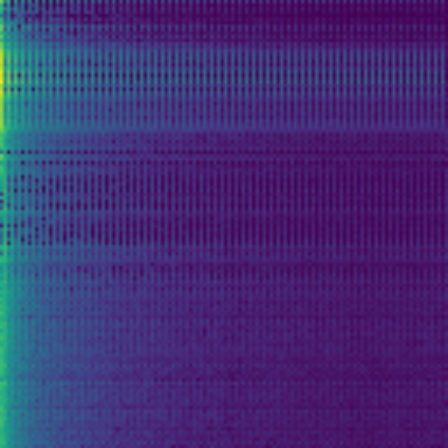
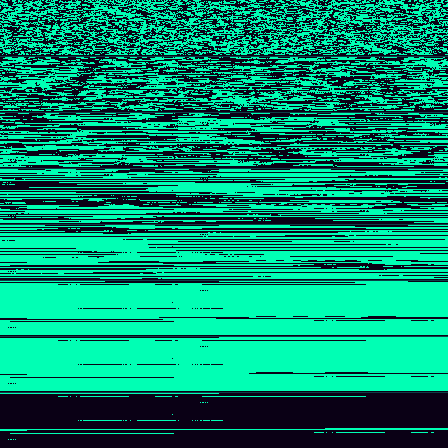
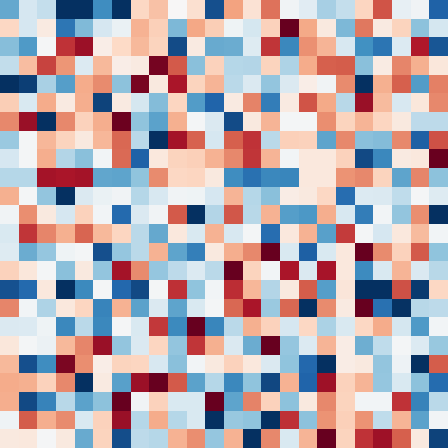
Native > triple_latticeraw

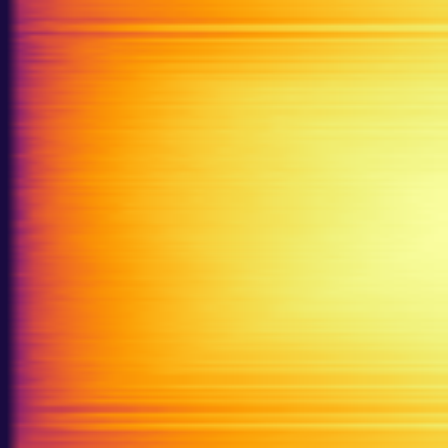
Boltzmann > lag_map

Boltzmann > spin_grid
Cayley > default
Chladni > plate_bottom
Chladni > plate_top
_(centered)/signed_log_z/SIR_Epidemic.png)
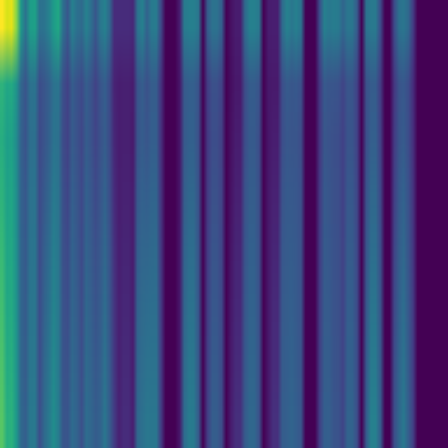
Heisenberg (Nil) (centered) > signed_log_z
_(centered)/xy_path/SIR_Epidemic.png)
Heisenberg (Nil) (centered) > xy_path
Hodge–Laplacian > default
/barcode/SIR_Epidemic.png)
Inflation (Substitution) > barcode
/d_curve/SIR_Epidemic.png)
Inflation (Substitution) > d_curve
Information Theory > default
Julia Set > escape_histogram
Klein Bottle > default
Laplacian > default
Logarithmic Spiral > default

Möbius-S³ > mobius_cylinder

Möbius-S³ > s2_base_map
Ordinal Partition > default
/phi_spectrum/SIR_Epidemic.png)
Penrose (Quasicrystal) > phi_spectrum

Persistent Homology > barcode

Persistent Homology > h1_diagram
Predictability > default

Recurrence Quantification > default
Spectral Analysis > default
Spectral Graph > default
Spirograph > mode_spectrum
Spirograph > phasor_trajectory
Symplectic > flux_grid
Symplectic > phase_space
/default/SIR_Epidemic.png)
Ulam Spiral (Sacks) > default
/default/SIR_Epidemic.png)
Ulam Spiral (Square) > default
Visibility Graph > default

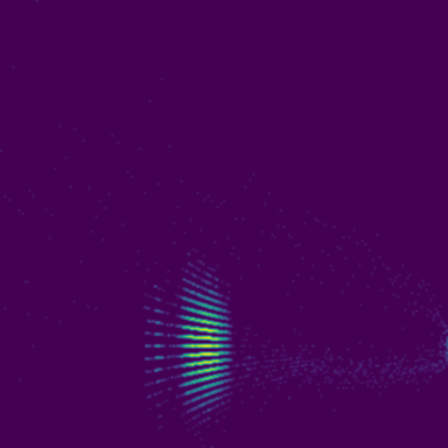
Wavelet Cascade > default
Atlas Position
| Nearest neighbor | Distance | |
|---|---|---|
| Barometric Pressure (Buoy) | 4.02 | cross-domain |
| Potomac River Flow | 4.06 | cross-domain |
| Pressure | 4.26 | cross-domain |
Which Geometries Light Up
Catch24 › Catch24:DN_OutlierInclude_n_001_mdrmd | rank 298/298 | -0.6089 |
Catch24 › Catch24:DN_OutlierInclude_p_001_mdrmd | rank 298/298 | -0.9572 |
Higher-Order Statistics › Higher-Order Statistics:c3_energy | rank 4/298 | 2.7512 |
H² × ℝ (Thurston) › H² × ℝ (Thurston):hyperbolic_step_dispersion | rank 295/298 | 0.0311 |
Klein Bottle › Klein Bottle:linear_complexity | rank 5/298 | 1.0199 |
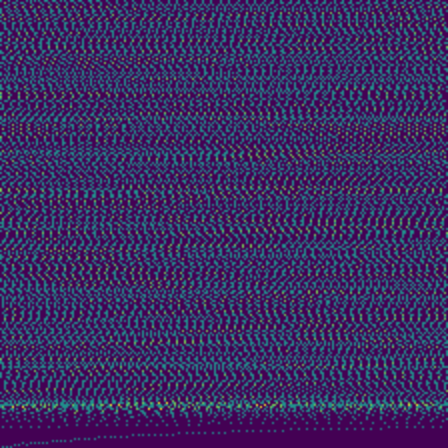
Moiré › Moiré:moire_dilation_entropy | rank 5/298 | 4.1594 |
Moiré › Moiré:moire_integer_excess | rank 296/298 | -0.3482 |
Nonstationarity › Nonstationarity:variance_trend | rank 296/298 | -0.2249 |
← Phyllotaxisin waveform
← / → within domain · ⇧← / ⇧→ alphabetical · ⇧← / ⇧→ inside an open render = same view across sources