S&P 500 Returns
financial · 37 views
financialstochastic
What It Is
S&P 500 daily close-to-close log returns (^GSPC, 1928+). The canonical U.S. equity benchmark; heavy tails, volatility clustering, leverage effects.
Interpretation
Standard analysis sees: heavy-tailed; left-skewed; time-irreversible (sharp rises, slow decay). The atlas finds no named structure, but the source is distinctively extreme on Wasserstein:distributional_stationarity (-2.8z) — beyond what the standard bank predicts for it.
What standard analysis sees
tail heaviness0.94
asymmetry0.02
occupancy0.28
short-range corr0.39
long-range memory0.41
spectral colour0.71
periodicity0.17
complexity0.85
time-irreversibility0.94
volatility clustering0.47
multifractality0.51
dimensionality0.68
nonstationarity0.81
What the atlas adds
Atlas-extreme metrics the standard bank can’t predict for this source
Wasserstein:distributional_stationarity | -2.8z | bank-miss 1.3σ |
Mostow Rigidity:distance_rigidity | -2.6z | bank-miss 1.9σ |
Nonstationarity:ac1_trend | -2.4z | bank-miss 1.3σ |
Composition
dtypefloat64
range[-0.229, 0.1096]
unique values16286 / 16384
mean ± std0.000273 ± 0.0101
Render Gallery
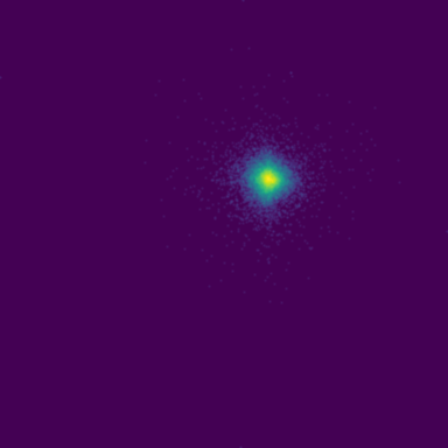
Native > phase_plotraw
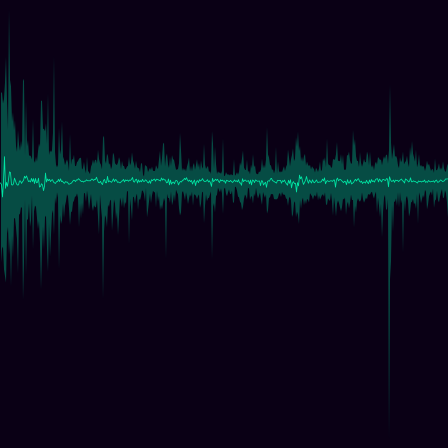
Native > timeseriesraw

Native > triple_latticeraw

Boltzmann > lag_map

Boltzmann > spin_grid
Cayley > default
Chladni > free_plate_nodal

Chladni > plate_bottom

Chladni > plate_top
_(centered)/signed_log_z/S&P_500_Returns.png)
Heisenberg (Nil) (centered) > signed_log_z
_(centered)/xy_path/S&P_500_Returns.png)
Heisenberg (Nil) (centered) > xy_path

Hodge–Laplacian > default
/barcode/S&P_500_Returns.png)
Inflation (Substitution) > barcode
/d_curve/S&P_500_Returns.png)
Inflation (Substitution) > d_curve
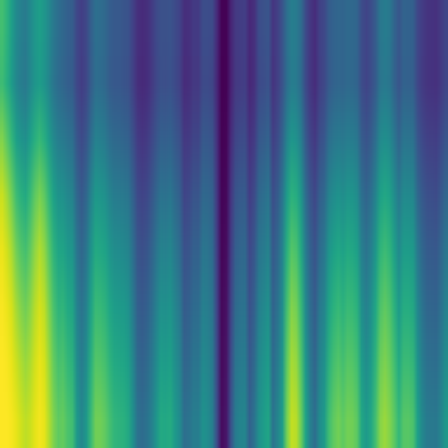
Information Theory > default
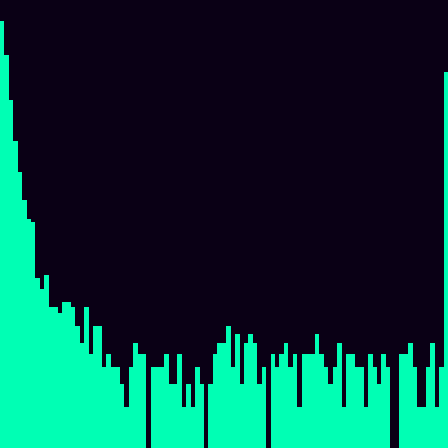
Julia Set > escape_histogram

Klein Bottle > default
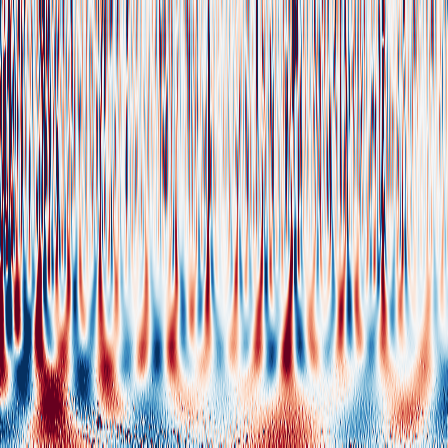
Laplacian > default

Logarithmic Spiral > default

Möbius-S³ > mobius_cylinder

Möbius-S³ > s2_base_map
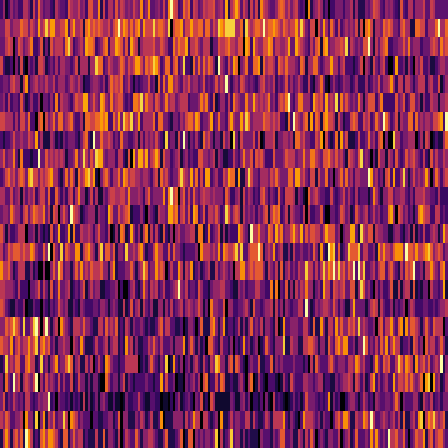
Ordinal Partition > default
/phi_spectrum/S&P_500_Returns.png)
Penrose (Quasicrystal) > phi_spectrum

Persistent Homology > barcode
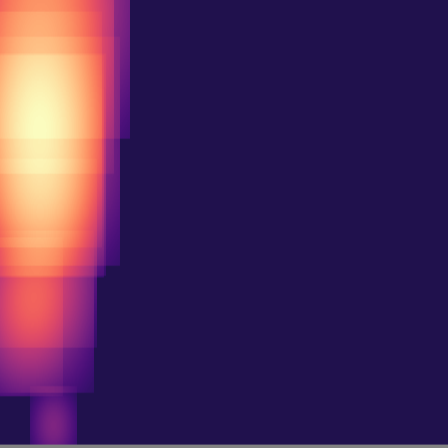
Persistent Homology > h1_diagram
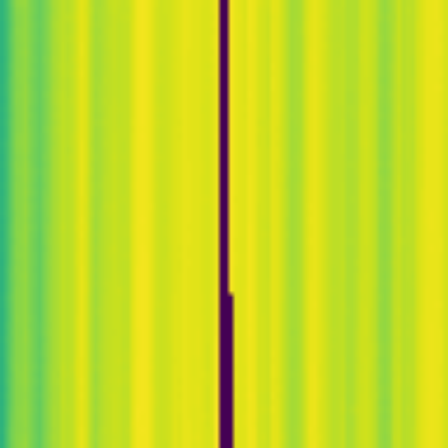
Predictability > default
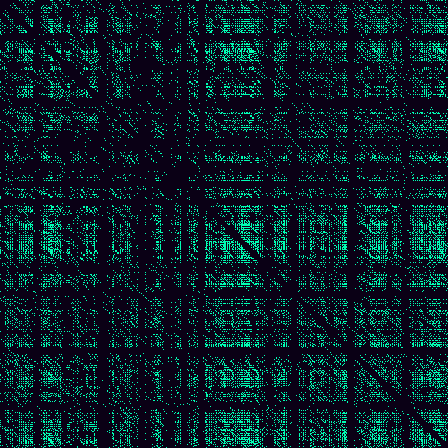
Recurrence Quantification > default
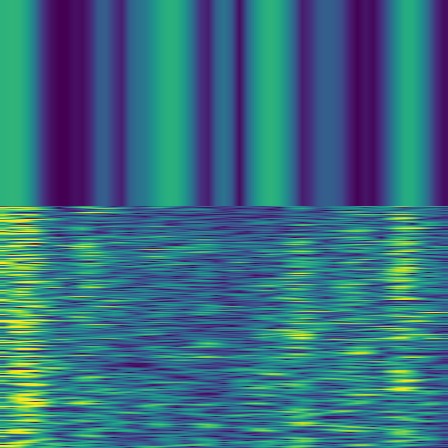
Spectral Analysis > default

Spectral Graph > default

Spirograph > mode_spectrum

Spirograph > phasor_trajectory

Symplectic > flux_grid

Symplectic > phase_space
/default/S&P_500_Returns.png)
Ulam Spiral (Sacks) > default
/default/S&P_500_Returns.png)
Ulam Spiral (Square) > default

Visibility Graph > default
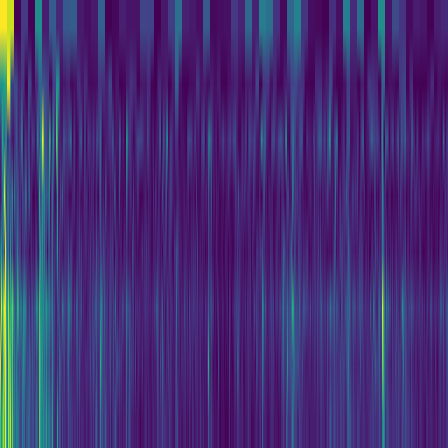
Wavelet Cascade > default
Atlas Position
| Nearest neighbor | Distance | |
|---|---|---|
| Nikkei Returns | 2.88 | |
| BTC Returns | 2.97 | |
| MFPT Inner Unloaded | 3.07 | cross-origin |
Which Geometries Light Up
Catch24 › Catch24:CO_trev_1_num | rank 4/306 | 2.2184 |
Catch24 › Catch24:DN_HistogramMode_10 | rank 303/306 | -1.0352 |
Catch24 › Catch24:DN_HistogramMode_5 | rank 303/306 | -1.0158 |
Cayley › Cayley:growth_exponent | rank 3/306 | 2.0601 |
Cayley › Cayley:spectral_gap | rank 3/306 | 0.0316 |
Cayley › Cayley:saturation_radius | rank 306/306 | 0.0080 |
Nonstationarity › Nonstationarity:ac1_trend | rank 302/306 | -0.1685 |
Wasserstein › Wasserstein:distributional_stationarity | rank 303/306 | 0.8328 |
← Nikkei Returnsin continuous-flows
← / → within domain · ⇧← / ⇧→ alphabetical · ⇧← / ⇧→ inside an open render = same view across sources